How the Monthly Unemployment Rate is Calculated
Each month, national, state and substate employment and unemployment statistics are generated and released to the public.
These statistics are jointly referred to as the civilian labor force (CLF) estimates. The methodology used to produce these data differs depending on the geographic area. All of the methodologies were developed by the U.S. Department of Labor, Bureau of Labor Statistics (BLS), and are uniformly applied across the nation. This document explains how unemployment rates are calculated for the nation, the states and substate areas.
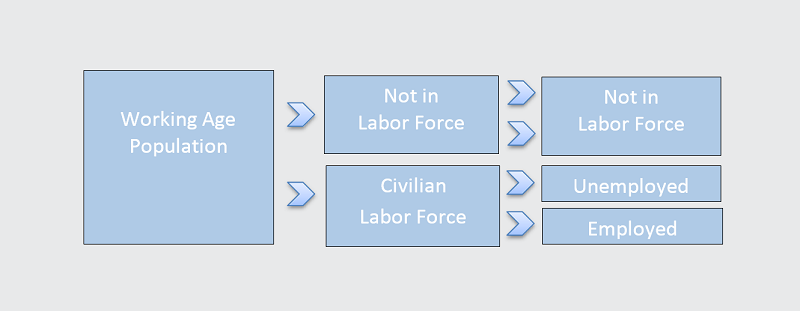
The unemployment rate for any area is calculated by taking the number of residents who are without a job and looking for work, dividing that number by the total number of residents in the labor force, and multiplying by 100. The labor force is the sum of everyone in an area who is employed and everyone in an area who is unemployed but actively seeking work.
Unemployment Rate = (# of unemployed / # in labor force) x 100
The number of employed workers includes…
|
The number of unemployed workers includes…
|
National Unemployment Rate
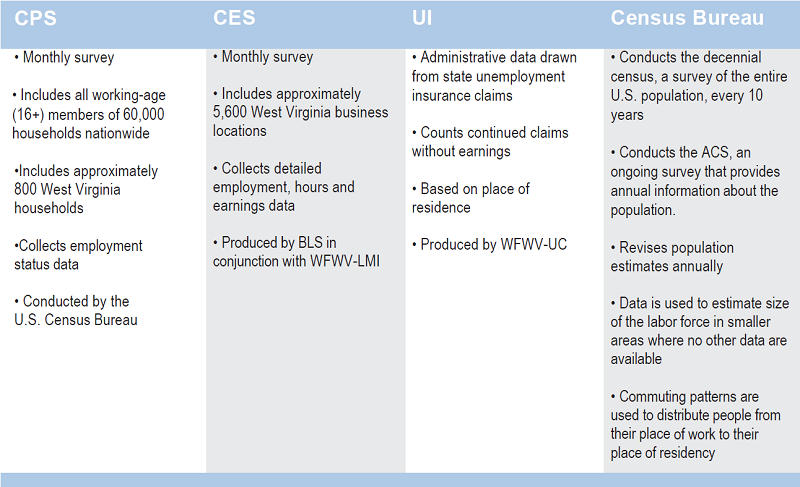
The data for the national unemployment rate comes directly from the Current Population Survey (CPS), a monthly survey conducted by the U.S. Census Bureau. The CPS samples approximately 60,000 U.S. households, of which approximately 800 households are in West Virginia. A respondent in the household is asked a series of questions about the employment status of the residents ages 16 and older in the household. From these responses, BLS estimates the size of the labor force, the number of people who are jobless and the monthly unemployment rate.
- Data Source:
CPS - Calculation:
(# Unemployed and Looking for Work / # in Labor Force) x 100
State Unemployment Rate
The CPS sample alone is too small to provide reliable civilian labor force estimates for states. To more accurately estimate the number of residents of a state who are employed and unemployed, BLS developed statistical models. These models use time series regression techniques and are based on data from three sources: the Current Employment Statistics (CES) program, state unemployment insurance (UI) systems, and historical and current data from the CPS.
The CES is a monthly survey of businesses, including approximately 5,600 businesses in West Virginia. Commonly referred to as the “establishment survey,” it provides a count of jobs and where those jobs are located. In the CPS a person is counted once, regardless of the number of jobs held. In the CES, however, a person working more than one job is counted for each job held.
BLS includes data from state UI systems as part of its statistical models. Specifically, to estimate unemployment, it includes the number of continued weekly unemployment claims without earnings filed by West Virginia residents.
Data from the monthly CPS survey of approximately 800 West Virginia households also factors into the BLS models. This ensures that all of the following groups are included in the calculations: those who are new to the workforce, those who are reentering the workforce, those who have exhausted their unemployment benefits and are still seeking work, those who are ineligible for unemployment benefits, and those who choose not to file unemployment claims.
BLS uses a “signal-plus-noise” time series regression model in its state estimates, to reduce estimation errors as a result of using a sample. It also ensures that the monthly employment and unemployment estimates for all states add up to the monthly employment and unemployment estimates for the nation as a whole.
- Data Sources:
Current and historical data from the CPS, CES and UI system - Calculation:
Model based on time series regression techniques
Substate Unemployment Rates (Metropolitan Areas, Counties and Cities)
In order to produce meaningful employment and unemployment estimates and unemployment rates for metropolitan areas, counties and cities, BLS uses a model known as the “Handbook Method,” as well as “disaggregation” techniques and a variety of data sources, including the CPS, CES, state UI systems, the American Community Survey (ACS) and the decennial census.
To separate out – or disaggregate – an estimate of unemployed workers in a city, BLS looks at the ratio of the number of unemployment claims filed in that city to the number of unemployment claims filed in the larger “labor market area” (LMA). It estimates the number of new unemployed workers based on the latest available census distribution of adults and teenagers in that city. To estimate the number of employed workers in a city, BLS uses a ratio of updated current population figures to statewide employment numbers. Finally, it adjusts substate estimates to include unemployment claims and employment data for LMAs shared with neighboring states: Kentucky, Maryland, Ohio, Pennsylvania and Virginia.
Once it estimates the number of employed and unemployed state residents, BLS determines the size of the labor force (sum of employed and unemployed workers) and the unemployment rate (the percent of the labor force that is unemployed) for all counties and cities with populations of more than 25,000.
The substate employment and unemployment estimates are not seasonally adjusted. This means they may have predictable increases and decreases at certain times of the year. For example, construction employment may decline during the winter; new college graduates may increase the size of the labor force in the summer.
- Data Sources:
CPS, CES, UI, ACS, decennial census and other annual census data - Calculation:
Model-based U.S. DOL Handbook Methodology
Data Revisions
Each month’s civilian labor force estimates are revised the following month and at the end of each year. Revisions at the end of the year are called “annual processing.” Typically, adjustments are made to the previous two years. Adjustments are necessary because more information becomes available throughout the year on nonfarm jobs and unemployment claims, which can affect the unemployment rate. Also, during annual processing,Also, during annual processing, new population controls are incorporated into the estimates. Population controls refer to population data such as vital statistics on births, deaths, migration, school enrollment, those living in group quarters and those living in institutions. The U.S. Census Bureau updates population controls annually and provides them to BLS. Usually, the revised population controls proportionately raise or lower the size of the labor force estimates. Unemployment rates, labor force participation rates and employment/population ratios are typically unaffected.
Data Source Summaries
Advantages and Limitations
Limitations of Methodologies
- The surveys do not distinguish between full- and part-time employment.
- Discouraged workers and those who may be underemployed are not captured.
- Respondents must be working during the reference week to be counted as employed that month. The reference week usually includes the 12th, except in November and December, when it may be the week of the 5th.
- Because the numbers are estimates, they have margins of error.
- BLS does not conduct surveys in every labor market area.
Advantages of Methodologies
- The unemployment rates provide a reasonable approximation of the number of unemployed.
- All states use the same methodology, which allows for accurate comparisons between states and regions.
- Because the CPS collects other information, CLF estimates are available by age, sex, race and educational attainment nationally and for the state, but not for substate areas.
CPS Sample Selection
Primary Sampling Units (PSU)
To conduct the CPS, the U.S. Census Bureau first divides the nation’s 3,141 counties into 2,007 PSUs.
Key Characteristics of PSUs:
- Made up of one county or multiple contiguous counties within a state.
- Typically includes rural and urban areas.
- Typically includes a variety of socioeconomic conditions.
- Typically include diverse occupations and industries.
Ultimate Sampling Units (USU)
Then, to determine which households from the PSUs to include in the survey, the Census Bureau uses block-level data to generate USUs.
Key Characteristics
- Composed of about four housing units close to one another, but not adjacent.
- Representative of the demographic and socioeconomic characteristics of the PSU.
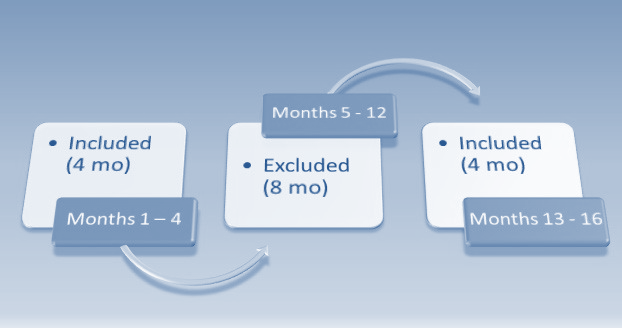
Rotation of Households in the Sample
After a household is selected, it is included in the sample, on and off, for a 16-month period. Then it is replaced. More specifically, sampled households are rotated in and out of the CPS so that 75 percent of the households are the same month to month, and 50 percent are the same year to year. This allows for more accurate month-to-month and year-to-year comparisons.
To view current West Virginia CLF data, visit the West Virginia Labor Market Information website at http://lmi.workforcewv.org/
Additional Information on BLS Methodology for CLF Data
U.S. Department of Labor, Bureau of Labor Statistics. BLS Handbook of Methods, Chapter 4: Measurement of Unemployment in States and Local Areas.
Retrived from http://www.bls.gov/opub/hom/pdf/homch4.pdf
Click Here to download a pdf version is this page.
Revised: May 26 2016